Burr Oak, Michigan
| People | Burr Oak | Michigan Avg | U.S. Avg |
|---|---|---|---|
| Population | 809 | 9,517 | 10,346 |
| Median Age | 37 yrs | 43 yrs | 42 yrs |
| Non-white Population | 5.1% | 9.5% | 13.4% |
| Total Households | 280 | 3,743 | 3,838 |
| Work | Burr Oak | Michigan Avg | U.S. Avg |
|---|---|---|---|
| Total Labor Force | 340 | 4,666 | 5,309 |
| Unemployment Rate | 2.8% | 6.8% | 6.0% |
| Per Capita Income | $20,124 | $27,621 | $28,477 |
| Median Household Income | $48,693 | $53,674 | $55,631 |
| Education | Burr Oak | Michigan Avg | U.S. Avg |
|---|---|---|---|
| No High School Diploma | 20.0% | 9.6% | 12.0% |
| High School Diploma | 61.7% | 58.0% | 56.1% |
| College Degree | 18.3% | 32.4% | 31.9% |
| Housing | Burr Oak | Michigan Avg | U.S. Avg |
|---|---|---|---|
| Median Property Value | $89,300 | $132,920 | $160,455 |
| Housing Units | 354 | 4,329 | 4,323 |
| Housing Units per Acre | 0.0 | 0.5 | 0.4 |
| Vacancy Rate | 20.9% | 17.8% | 16.8% |
| Median Rent | $641/month | $753/month | $766/month |
| Rent Burden* | 34.7% | 36.9% | 33.5% |
| People per Room | 0.37 | 0.35 | 0.39 |
| Transportation | Burr Oak | Michigan Avg | U.S. Avg |
|---|---|---|---|
| Public Transit Use** | 1.3% | 0.6% | 1.0% |
| Average Commute | 23 min | 25 min | 25 min |
| Security | Burr Oak | Michigan Avg | U.S. Avg |
|---|---|---|---|
| Poverty Rate | 4.2% | 3.6% | 5.1% |
| No Health Insurance | 11.1% | 8.6% | 11.1% |
| Public Assistance*** | 5.6% | 8.3% | 7.8% |
| Food Stamps | 11.9% | 13.0% | 12.2% |
| Industry | Burr Oak | Michigan Avg | U.S. Avg |
|---|---|---|---|
| Agriculture and Mining | 4.7% | 3.1% | 6.1% |
| Construction | 4.4% | 6.5% | 7.4% |
| Manufacturing | 38.1% | 19.1% | 13.0% |
| Wholesale | 1.2% | 2.2% | 2.6% |
| Retail | 14.2% | 11.2% | 11.2% |
| Transportation | 1.6% | 4.5% | 5.7% |
| Information | 0.7% | 1.3% | 1.5% |
| Finance | 1.8% | 4.7% | 4.9% |
| Professional | 6.0% | 7.6% | 7.4% |
| Education and Health | 14.6% | 22.1% | 22.9% |
| Recreation and Food | 5.4% | 9.0% | 7.7% |
| Public Administration | 4.5% | 3.9% | 4.9% |
| Other | 2.7% | 4.7% | 4.6% |
Financial Information
| Revenue | Burr Oak (000s) | Per Capita | Michigan Avg | U.S. Avg |
|---|---|---|---|---|
| Property Taxes | $136 | $168 | $437 | $528 |
| General Sales Tax | $0 | $0 | $0 | $119 |
| Selective Sales Tax | $0 | $0 | $1 | $53 |
| Individual Income Tax | $0 | $0 | $11 | $30 |
| Corporate Income Tax | $0 | $0 | $0 | $1 |
| Motor Vehicle License Tax | $0 | $0 | $0 | $3 |
| Other Taxes | $7 | $9 | $20 | $52 |
| Current Charges | $253 | $313 | $413 | $311 |
| Utility Revenue | $218 | $269 | $333 | $419 |
| Liquor Store Revenue | $0 | $0 | $0 | $12 |
| Insurance Trust Revenue | $0 | $0 | $49 | $22 |
| Misc. Revenue | $19 | $23 | $140 | $125 |
| Intergovernmental | $228 | $282 | $353 | $324 |
| Long Term Debt Issued | $0 | $0 | $172 | $137 |
| Total Revenue | $861 | $1,064 | $1,930 | $2,137 |
| Expenses | Burr Oak (000s) | Per Capita | Michigan Avg | U.S. Avg |
|---|---|---|---|---|
| Education | $0 | $0 | $0 | $71 |
| Public Safety | $154 | $190 | $194 | $246 |
| Correction | $0 | $0 | $0 | $18 |
| Hospitals | $0 | $0 | $8 | $30 |
| Health | $0 | $0 | $7 | $15 |
| Public Works | $415 | $513 | $385 | $171 |
| Highways | $121 | $150 | $201 | $147 |
| Other Transportation | $0 | $0 | $3 | $6 |
| Housing and Community Dev | $0 | $0 | $29 | $12 |
| Public Welfare | $0 | $0 | $0 | $7 |
| Natural Resources | $0 | $0 | $0 | $4 |
| Parks and Recreation | $8 | $10 | $61 | $51 |
| Libraries | $5 | $6 | $11 | $12 |
| Administration | $21 | $26 | $98 | $162 |
| Judicial and Legal | $0 | $0 | $10 | $19 |
| Interest Expense | $28 | $35 | $33 | $62 |
| Utility Expenses | $73 | $90 | $149 | $385 |
| Liquor Store Expenses | $0 | $0 | $0 | $11 |
| Insurance Trust Expenses | $0 | $0 | $33 | $15 |
| Other Expenses | $0 | $0 | $291 | $132 |
| Intergovernmental | $0 | $0 | $54 | $50 |
| Long Term Debt Retired | $49 | $61 | $148 | $191 |
| Capital Expenditures | $58 | $72 | $130 | $210 |
| Total Expenses | $932 | $1,152 | $1,847 | $2,025 |
| Balance Sheet | Burr Oak (000s) | Per Capita | Michigan Avg | U.S. Avg |
|---|---|---|---|---|
| Short Term Debt | $0 | $0 | $1 | $31 |
| Long Term Debt | $2,252 | $2,784 | $1,512 | $1,653 |
| Insurance Trust Funds | $0 | $0 | $533 | $151 |
| Other Trust Funds | $1,593 | $1,969 | $1,612 | $1,873 |
Human Energy Investment Calculator
Use the slider to select a social investment amount for this community. Then use the dropdown to
select among the various areas of focus available in this database. The calculator will display the estimated impact
of such an investment, in the forms of decreased municipal spend on social programs and/or increased property taxes by way of
increasing property values.
To get more detailed calculations and to modify this impact model, see the full Investment Calculator below.
To get more detailed calculations and to modify this impact model, see the full Investment Calculator below.
Program Category:
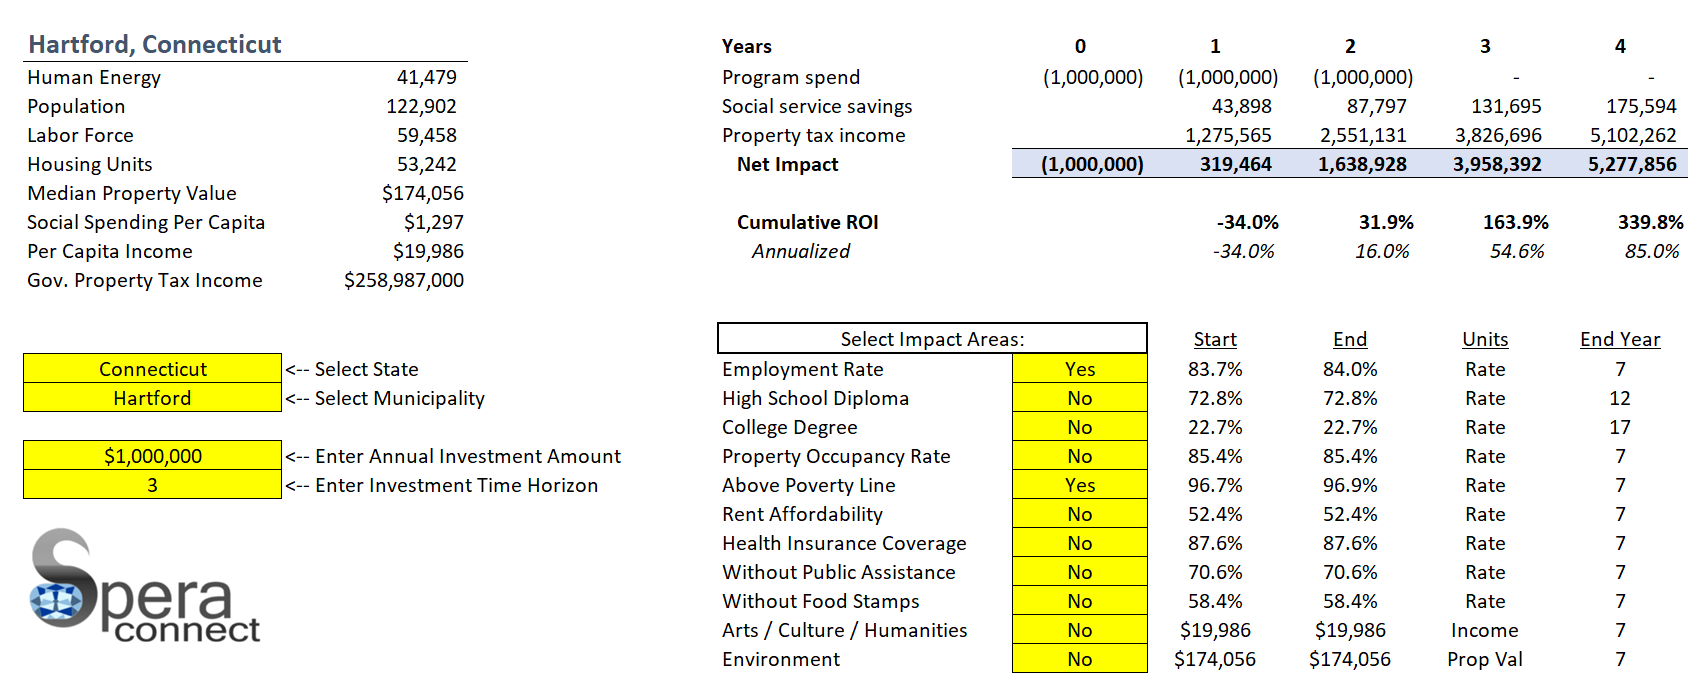
Human Energy Investment Calculator
Do you need help attracting funding for your nonprofit or social service program?
Use this Excel financial model to select from a list of social impact areas and model out investments in your city. Select from the universe of American municipalities, with official social, financial, and economic data from 2017 Census.
Choose an investment amount and time horizon and see how your program benefits the city in terms of:
1. Social service spending reductions
2. Property tax income increases
Nothing in this file is locked. Please use it at your convenience and modify, update, change as necessary. I hope this helps you fund ideas, attract investment and improve your community!
$7.00
$0.44 (tax)
Total: $7.44